Discover 7422 Tools
Visualize data, explore trends, share insights.
Visualize data effortlessly, explore trends, and create stunning visuals with Plot. Easily share data insights with others.
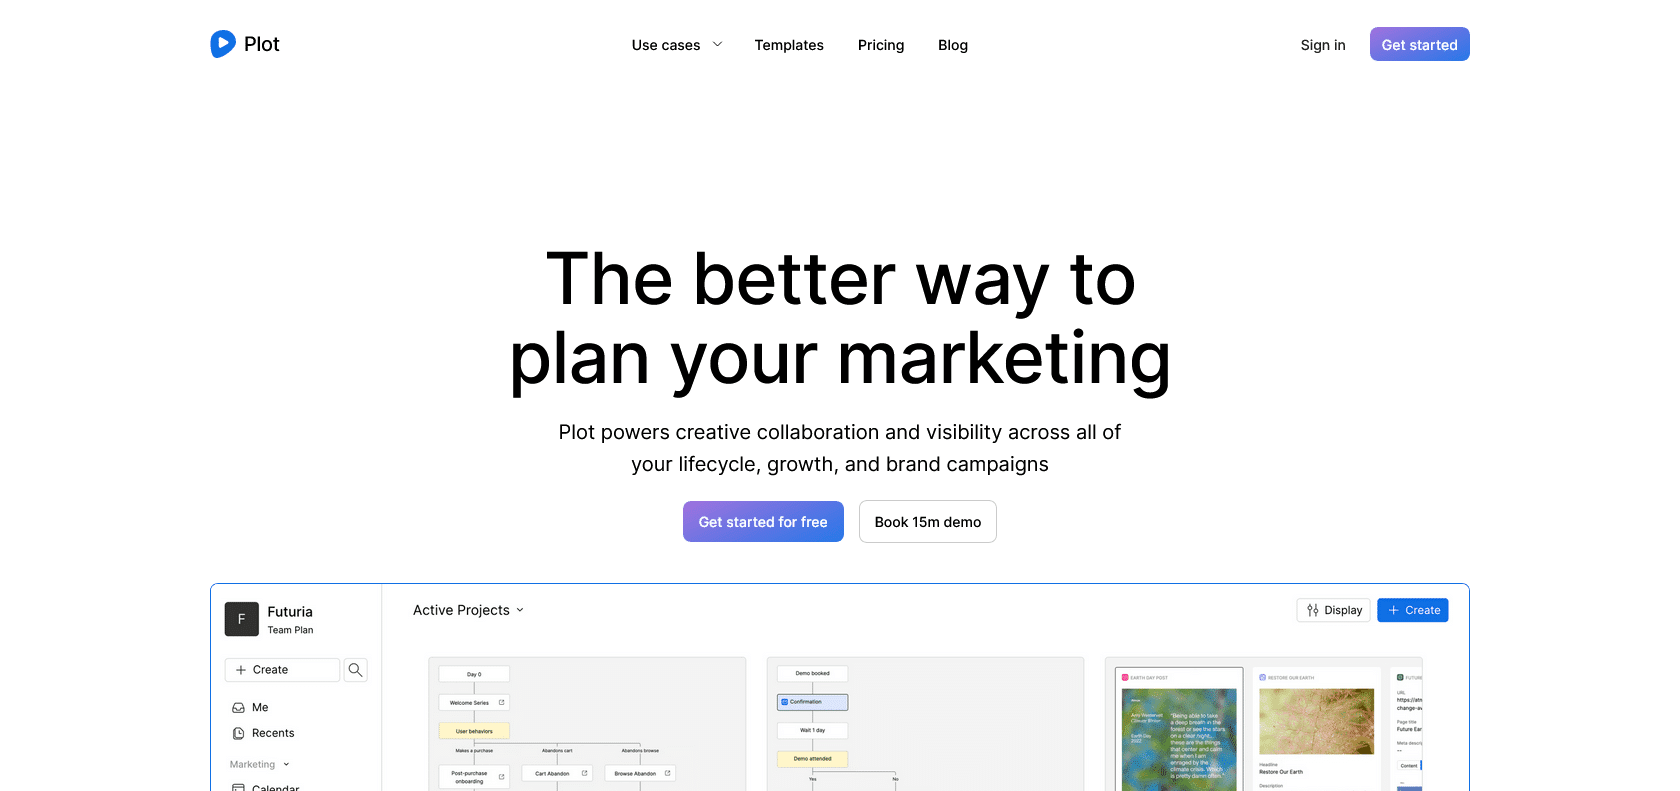
Plot is a powerful plotting tool that takes data exploration to the next level. With its intuitive interface, you can effortlessly dive into your data and uncover valuable insights. Whether you are a beginner or an advanced user, Plot offers the functionality you need to make sense of your data.
One of the key strengths of Plot is its ability to handle data from a variety of sources. This means you can easily import data from spreadsheets, databases, or even web APIs. With just a few clicks, you can bring all your data together in one place and start visualizing it in a meaningful way.
But Plot doesn't stop at basic plotting. It goes beyond the surface-level to help you understand trends, relationships, and patterns. With a wide range of chart types and customization options, you have the flexibility to create stunning visuals that perfectly illustrate your data. Whether you need bar charts, line graphs, scatter plots, or even more complex visualizations, Plot has got you covered.
Another standout feature of Plot is its collaboration capabilities. You can easily share your data insights with others by exporting your graphs and charts in various formats or by directly sharing interactive plots. This way, you can collaborate with your team, stakeholders, or clients seamlessly and get everyone on the same page.
In a nutshell, Plot is the go-to tool for anyone looking to make their data come alive. With its user-friendly interface, powerful functionality, and seamless collaboration features, you can explore your data with ease and get the most out of it.
Plot is an invaluable tool for anyone looking to accelerate productivity in their job or business. Whether you are a data analyst, researcher, marketer, or business owner, Plot can help you make sense of your data and uncover valuable insights.
For data analysts and researchers, Plot provides a powerful platform to visualize and explore data from various sources. With its intuitive interface and extensive functionality, it allows you to quickly plot and analyze data, making it easier to identify trends, patterns, and relationships. This enables you to make informed decisions and drive data-based strategies.
Marketers can benefit from Plot by using its visualizations to better understand customer behavior, market trends, and campaign performance. With the ability to customize graphs and charts to their exact specifications, marketers can create stunning visuals that effectively convey their data insights. These visuals can then be shared with team members or clients to align strategies and drive marketing success.
Business owners can utilize Plot to analyze sales data, monitor key performance indicators, and track business growth. By visualizing data in an easy-to-understand format, Plot helps business owners identify areas of improvement, spot emerging trends, and make data-driven decisions. With the ability to share data insights with stakeholders, Plot also facilitates collaboration and alignment within the organization.
Make data come alive and gain valuable insights.
Plot is a powerful tool that offers numerous benefits for real-world applications. One of the key advantages is its ability to quickly visualize data and explore trends. Whether you're analyzing sales figures, survey responses, or any other type of data, Plot allows you to easily plot and visualize the data, enabling you to identify patterns and trends that may not be immediately obvious.
Another notable benefit of Plot is its capability to create stunning visuals and customize graphs to your exact specifications. You can choose from a wide range of chart types, such as bar charts, line graphs, scatter plots, and more, and easily customize them with different colors, styles, and other design elements. This allows you to tailor the visuals to suit your specific needs and branding, making it easier for others to understand and interpret the data.
Additionally, Plot simplifies the process of sharing data insights with others. Whether you're collaborating with colleagues, presenting to stakeholders, or simply sharing findings with clients or team members, Plot provides easy sharing options. You can easily export your graphs as image files or interactive web links, allowing others to access and interact with the data even without Plot installed. This makes it convenient to distribute your insights and collaborate with others, fostering better communication and decision-making.
Plot is a fantastic tool for anyone looking to visualize and explore their data. With its powerful capabilities, Plot allows users to easily analyze and understand trends, patterns, and relationships within their datasets. Whether you're a beginner or an advanced user, Plot offers the functionality you need to make sense of your data.
One of the standout features of Plot is its ability to quickly generate visualizations. With just a few clicks, you can transform your raw data into informative and visually appealing graphs and charts. Whether you need a simple line graph or a complex scatter plot, Plot has you covered. Its intuitive interface makes it easy to select the type of visualization you want and customize it to your exact specifications.
Customization is another key aspect of Plot. You have the freedom to fine-tune your graphs and charts to suit your needs. From choosing colors and fonts to adjusting axis labels and titles, Plot gives you full control over every aspect of the visualization. This level of customization ensures that your visualizations not only convey the necessary information but also align with your brand or personal style.
Sharing your data insights with others is also a breeze with Plot. Whether you need to collaborate with colleagues or present your findings to stakeholders, Plot makes it simple to share your visualizations. You can easily export your graphs and charts in various formats, such as PNG or PDF, and share them via email or other messaging platforms. This feature allows for seamless collaboration and effective communication of your data insights.
Overall, Plot is an excellent tool for anyone working with data. Its ease of use, powerful visualization capabilities, and intuitive customization options make it a top choice for both beginners and experts. With Plot, you can bring your data to life and gain valuable insights that will help you make informed decisions.
Join the AI revolution and explore the world of artificial intelligence. Stay connected with us.
Copyright © 2024 AI-ARCHIVE
Today Listed Tools 213
Discover 7422 Tools