Discover 7422 Tools

Express your ideas with stunning visuals.
Discover the power of Piktochart for creating stunning infographics, engaging presentations, and professional reports with analytics. Get noticed today!

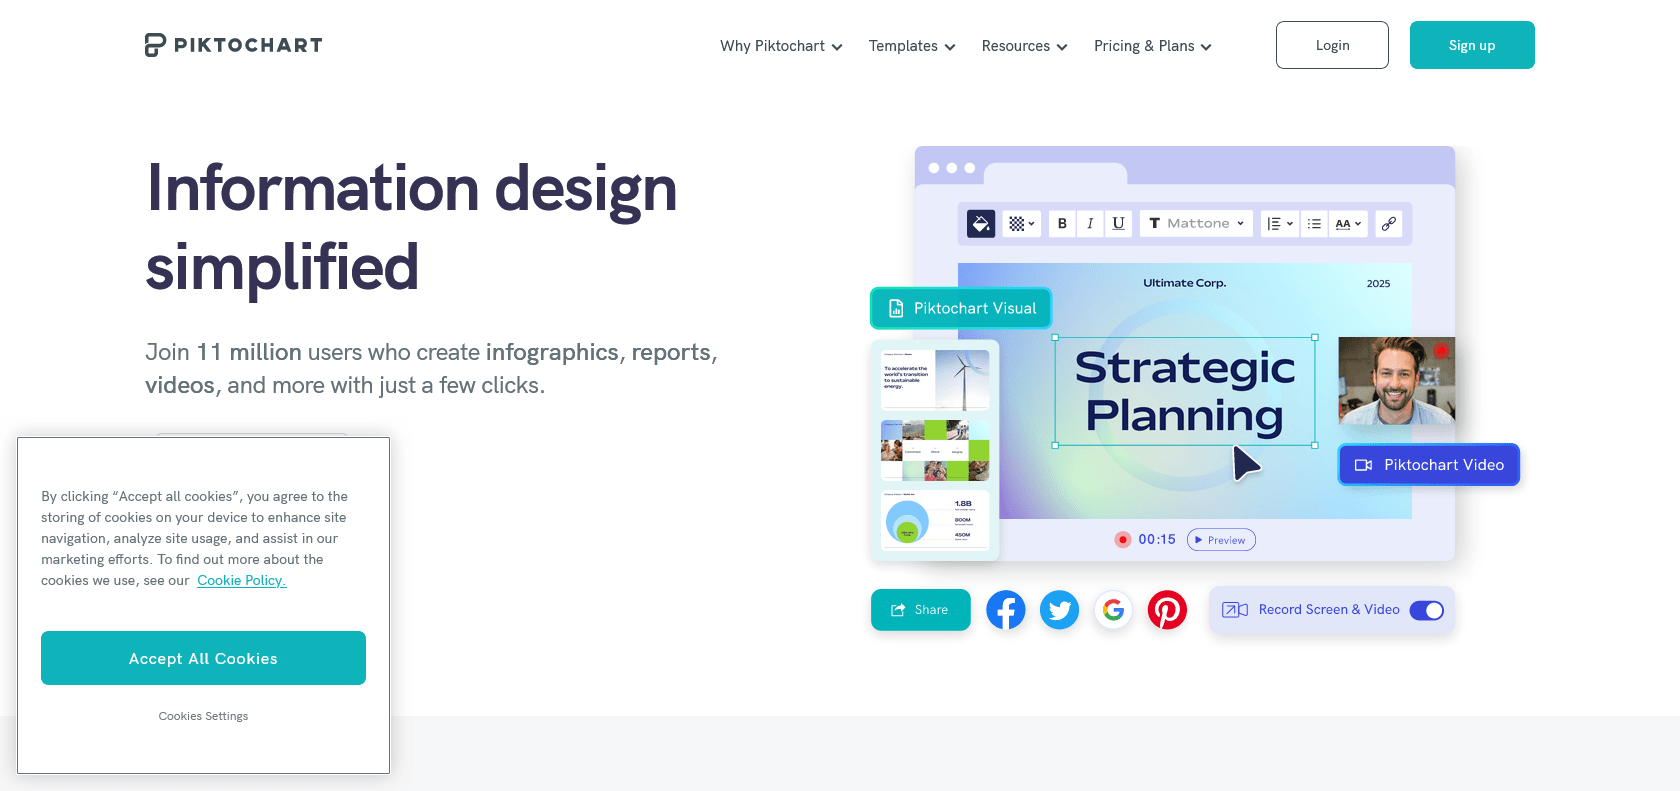
Piktochart is a game-changing tool that allows you to create stunning and visually appealing infographics, reports, presentations, and data visualizations. Whether you're a beginner or a seasoned designer, this user-friendly platform empowers you to express your ideas with ease and professionalism.
One of the standout features of Piktochart is its extensive library of high-quality templates, icons, and illustrations. These resources enable you to create visuals that not only look visually appealing but also grab the attention of your audience. From eye-catching charts and graphs to attractive diagrams, Piktochart has it all.
The intuitive drag-and-drop editor is another highlight of Piktochart. It makes customization a breeze, allowing you to effortlessly personalize your designs to suit your specific needs. You can easily add text, images, and other elements, ensuring that your visuals truly represent your ideas.
Furthermore, Piktochart offers a powerful analytics feature that lets you track the performance of your visuals. This feature provides valuable insights into how your creations are being engaged with, allowing you to make data-driven decisions and maximize their impact.
Create stunning infographics for social media
Design presentations to engage clients
Generate professional-looking reports with analytics
Piktochart

Join the AI revolution and explore the world of artificial intelligence. Stay connected with us.
Copyright © 2025 AI-ARCHIVE
Today Listed Tools 201
Discover 7422 Tools