Discover 7422 Tools

Gain deep insights with Grafana's analytics.
Discover the benefits of Grafana: monitor applications, systems, and infrastructure with visualizations, advanced alerting, and customizable dashboards.

Grafana is an open source platform that’s designed to make analytics and monitoring a breeze. With its powerful features and user-friendly interface, Grafana allows you to visualize data and monitor performance metrics with ease. Whether you’re a developer, a DevOps engineer, or an IT professional, Grafana has something to offer you.
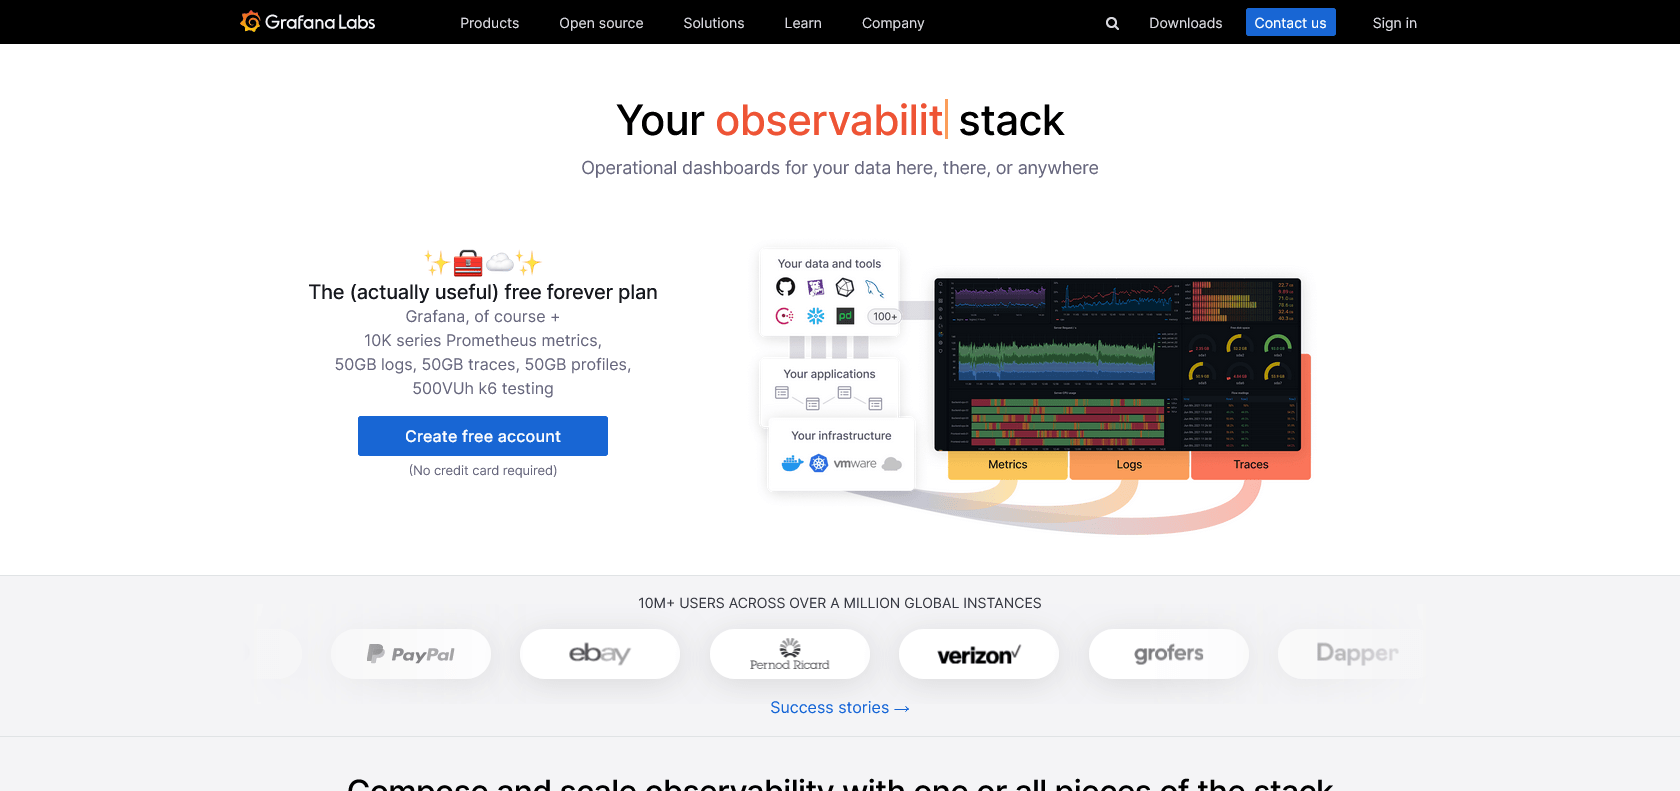
One of the standout features of Grafana is its ability to create visually stunning dashboards and charts. With just a few clicks, you can create a dashboard that displays all the relevant information you need to track. From application performance to system health, Grafana helps you keep a close eye on everything.
But Grafana doesn’t stop at just displaying data. It also offers advanced alerting and notification features. With these features, you can set up alerts for any metric you’re tracking. Whether it’s CPU usage, network latency, or database performance, Grafana will let you know if something goes wrong.
Another major strength of Grafana is its ability to integrate with various data sources. Whether you’re pulling data from a SQL database, a cloud service, or even a custom-built API, Grafana has got you covered. You can easily connect your data and create custom visualizations that suit your needs.
Gain valuable insights and make informed decisions with Grafana's powerful analytics capabilities.
Grafana

Join the AI revolution and explore the world of artificial intelligence. Stay connected with us.
Copyright © 2025 AI-ARCHIVE
Today Listed Tools 347
Discover 7422 Tools