Discover 7422 Tools

Transform data into stunning visuals effortlessly.
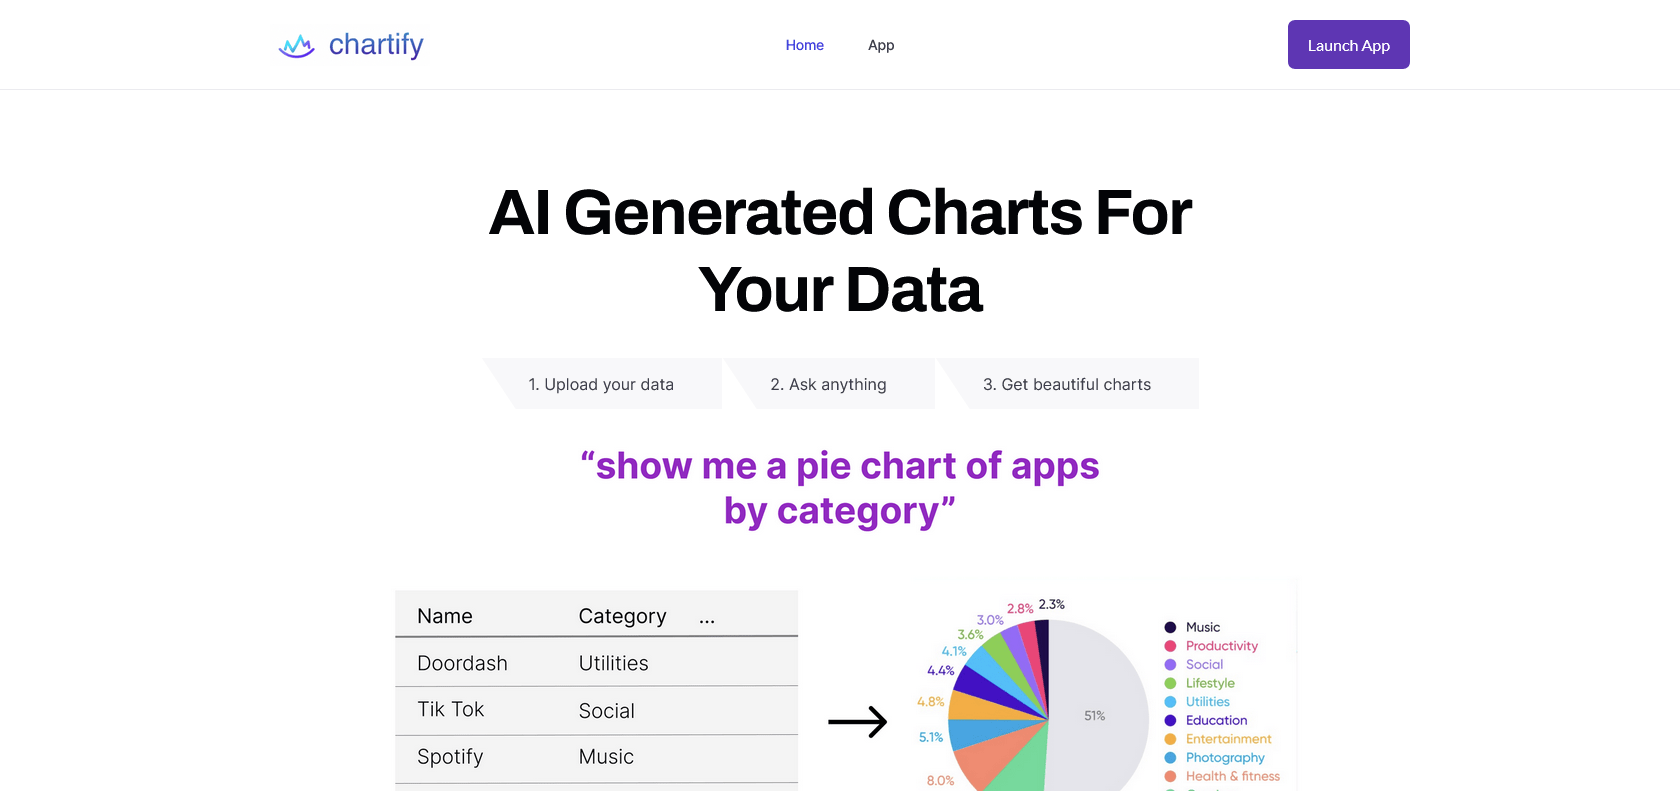
Create stunning visuals with Chartify, an AI-powered tool that simplifies data visualization. Upload data, get AI recommendations, and generate interactive charts.

Chartify is an impressive AI-powered tool designed to streamline the process of creating interactive charts and graphs for data visualization purposes. Its user-friendly interface allows users to effortlessly upload their data and receive AI recommendations for the most suitable visualization types, such as pie charts, bar charts, and line graphs. But what sets Chartify apart is its flexibility - users can also request specific chart types, which the AI will generate across popular frameworks including Plotly, Matplotlib, Seaborn, and Charts.js. This feature makes Chartify a valuable tool for data analysts, business analysts, and researchers who frequently need to generate visualizations quickly. Not only does Chartify save time, but it also offers a comprehensive range of options for creating visually stunning and informative graphics. With Chartify, users can transform their data into captivating visuals effortlessly.
Generate interactive charts in popular frameworks
Quick data upload and AI-recommended visualizations
Request specific chart types for customized visuals
Create stunning and informative data visuals
Chartify

Join the AI revolution and explore the world of artificial intelligence. Stay connected with us.
Copyright © 2025 AI-ARCHIVE
Today Listed Tools 200
Discover 7422 Tools