Discover 7422 Tools

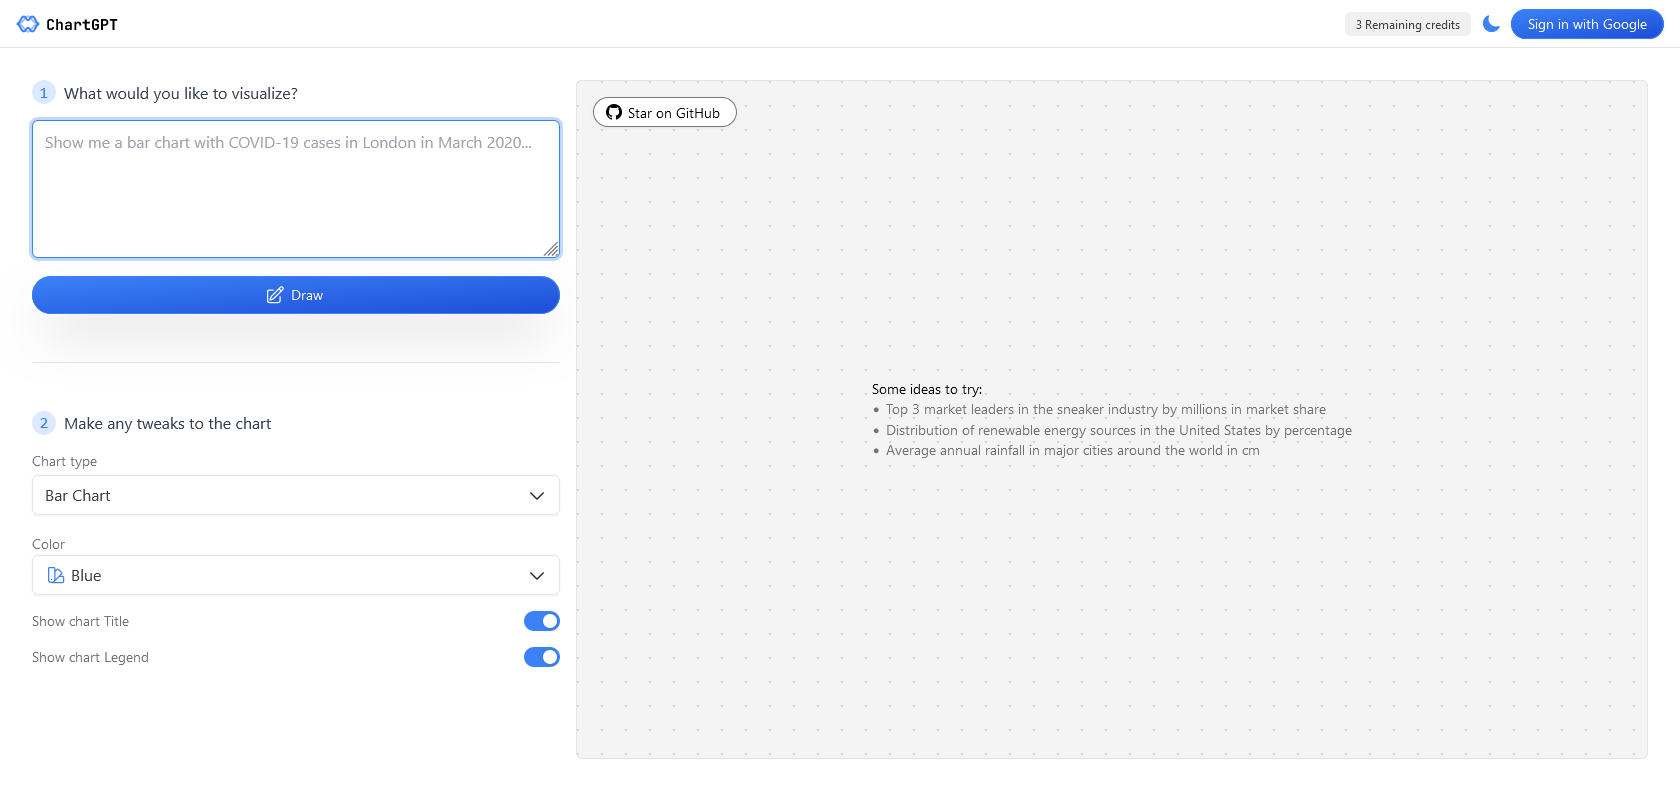
Screenshot of ChartGPT Website

Create stunning, interactive charts effortlessly.

ChartGPT: Transform Text into Stunning, Interactive Charts in Minutes

Transform text-based data into stunning, visually striking, and interactive charts with ChartGPT's intuitive interface and AI-driven automation.

ChartGPT

Share on:
Screenshot of ChartGPT Website

Effortlessly Create Stunning Charts with ChartGPT: Review and Features

ChartGPT is an impressive AI-powered tool designed to simplify the process of creating eye-catching charts. By using this software, you can effortlessly transform text-based data into visually striking and interactive charts in just a matter of minutes. Powered by React, Nextjs, OpenAI, and Tailwind CSS, ChartGPT eliminates the need for manual design and coding, making it a convenient choice for professionals, researchers, and students alike.

One of the standout features of ChartGPT is its ability to quickly and easily generate beautiful charts from text inputs. Whether you're working with complex data or simply need to present information in a visually appealing way, this tool has got you covered. It takes the hassle out of data visualization and enables you to effortlessly create stunning charts that are sure to captivate any audience.

ChartGPT offers a range of features and benefits that make data visualization a breeze. Its intuitive user interface, combined with AI-driven automation, ensures a seamless and user-friendly experience. With ChartGPT, you have everything you need to create charts that not only convey your message effectively but also stand out from the crowd.

For Who?

ChartGPT is an AI-powered tool that is incredibly useful for professionals, researchers, and students who need to accelerate their productivity in data visualization. Whether you work in a business setting, academic environment, or research field, ChartGPT can assist you in creating visually appealing charts from text inputs in a matter of minutes.

This tool is perfect for individuals who want to simplify the process of chart creation without needing extensive design or coding skills. With ChartGPT, you can say goodbye to the tediousness of manual chart design. Instead, you can focus on presenting your data in a way that truly captures the attention of your audience.

Regardless of your level of expertise in data visualization, ChartGPT offers an intuitive user interface that enables seamless chart creation. Through its AI-driven automation, you can transform text-based data into stunning charts with just a few simple steps. The software utilizes React, Nextjs, OpenAI, and Tailwind CSS to provide you with a streamlined and efficient experience.

Whether you are a market researcher who needs to present data to clients, a business professional who wants to enhance presentations, or a student working on a project, ChartGPT can help you accelerate your productivity. By eliminating the need for manual design and coding, this tool enables you to generate visually striking, interactive charts in a fraction of the time.

Main Features

Perfect for professionals, researchers, and students.

Benefits of using ChartGPT

ChartGPT is a powerful tool that revolutionizes the way charts are created. One of the key benefits of using ChartGPT is its ability to generate visually striking, interactive charts in just a matter of minutes. This means that professionals, researchers, and students can save valuable time by eliminating the need for manually designing and coding charts.

By leveraging the power of artificial intelligence, ChartGPT takes text-based data and transforms it into stunning charts. This feature is particularly useful for individuals who may not have a strong background in data visualization or coding. With ChartGPT, anyone can easily create beautiful charts from simple text inputs.

One of the standout features of ChartGPT is its intuitive user interface. The software is designed to be user-friendly, making it accessible to individuals with varying levels of technical expertise. Alongside this, ChartGPT also utilizes AI-driven automation, further streamlining the chart creation process. This means that even complex charts can be generated effortlessly with just a few simple steps.

Full Review

We recently had the opportunity to test out ChartGPT, an AI-powered tool that simplifies the process of creating charts. We were impressed by its ability to transform text-based data into visually striking, interactive charts in just a matter of minutes.

One of the standout features of ChartGPT is its intuitive user interface. It's incredibly user-friendly and straightforward, making it easy for anyone to navigate and utilize the tool effectively. The AI-driven automation further simplifies the entire process by eliminating the need for manual design and coding.

With ChartGPT, creating beautiful charts from text inputs is a breeze. Whether you're a professional, researcher, or student needing to present data, this tool is a game-changer. It takes the hassle out of data visualization, allowing you to quickly and effortlessly generate stunning charts that are sure to capture the attention of any audience.

ChartGPT offers a range of benefits and features that make data visualization easy and accessible. Its ability to generate visually striking and interactive charts in just a few simple steps is a game-changer. The software is powered by top-notch technologies like React, Nextjs, OpenAI, and Tailwind CSS, ensuring a seamless and efficient experience.

Overall, we found ChartGPT to be an impressive tool for creating charts. Its intuitive user interface, AI-driven automation, and visually appealing output make it a must-have for professionals, researchers, and students alike. Whether you're a data visualization novice or a seasoned pro, we highly recommend giving ChartGPT a try.

ChartGPT

Pros:

- Creates visually striking, interactive charts.
- Transforms text-based data into stunning visuals.
- Intuitive user interface with AI automation.
- Saves time by generating charts quickly.

Cons:

- Limited customization options for chart designs.
- May not be suitable for complex data analysis.

Popular AI

Similar Archives

{{ reviewsTotal }}{{ options.labels.singularReviewCountLabel }}
{{ reviewsTotal }}{{ options.labels.pluralReviewCountLabel }}
{{ options.labels.newReviewButton }}
{{ userData.canReview.message }}

Explore Similar AI Tools: