Discover 7422 Tools

Elevate your data with ChartBrick.
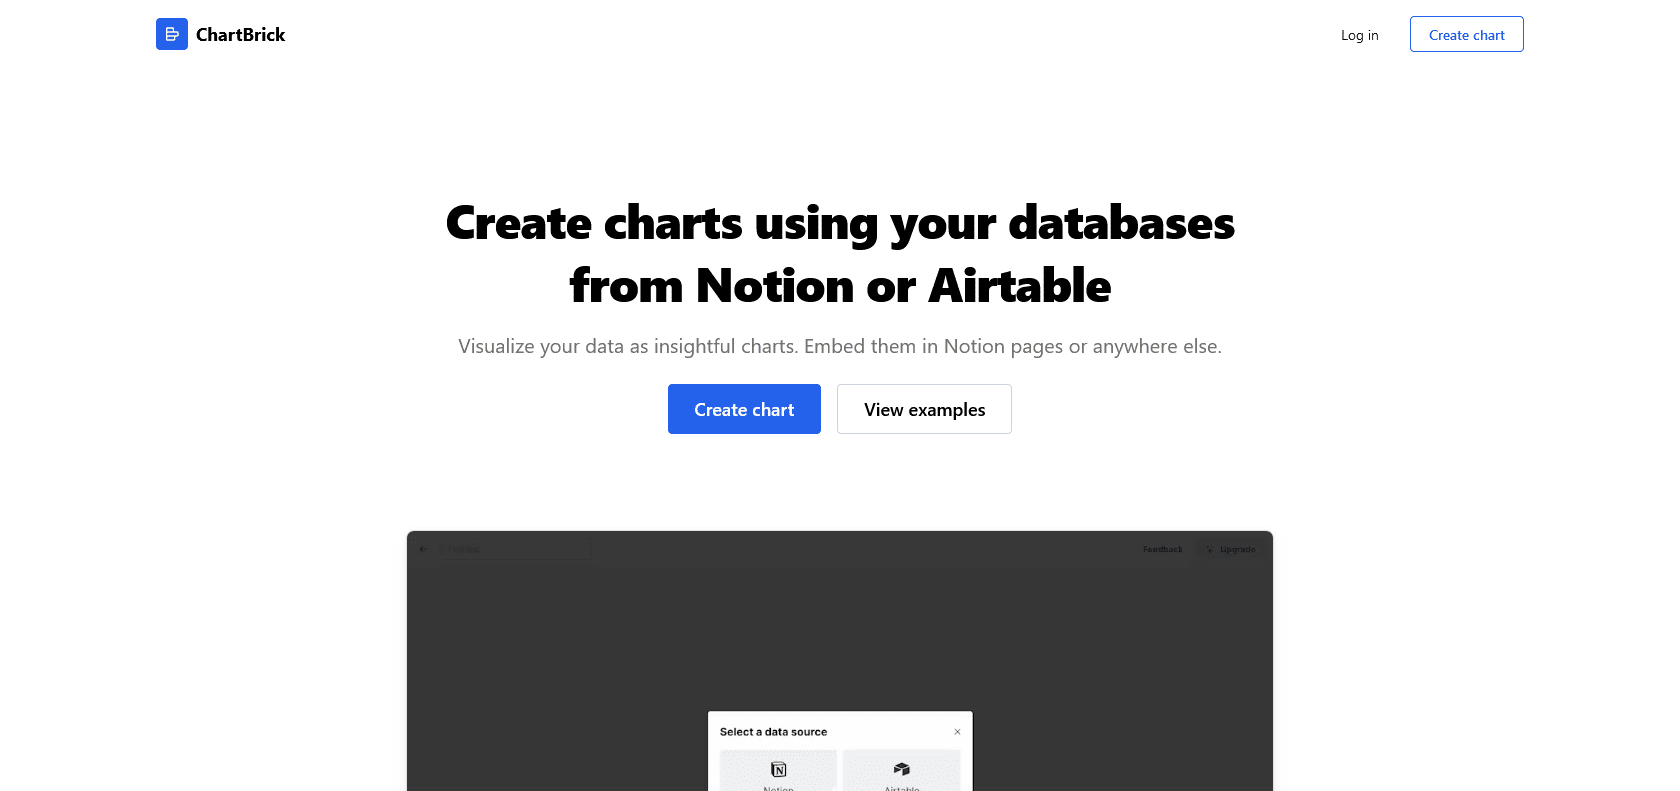
ChartBrick Review and Features: Easily create interactive charts, customize their appearance, access templates, and make data visually engaging with ChartBrick.

ChartBrick is an exceptional platform that brings the power of data visualization and analysis to users of all backgrounds. Whether you are a seasoned data analyst, a student, or simply someone who wants to make sense of their data, ChartBrick is designed to make the process quick, easy and visually appealing.
One of the standout features of ChartBrick is its intuitive drag-and-drop chart builder. With just a few clicks, you can transform your raw data into stunning interactive charts and visualizations. The user-friendly interface allows you to easily adjust settings and parameters, giving you complete control over the look and feel of your charts.
For those who want to take their visualizations to the next level, ChartBrick offers a library of pre-made templates and color schemes. These templates provide a starting point for your visualizations and allow you to effortlessly create professional-looking charts that will impress your audience.
Not only does ChartBrick make it easy to create visually engaging charts, but it also makes sharing your visualizations a breeze. With just a few clicks, you can share your charts with colleagues, clients, or classmates. This makes ChartBrick a valuable tool for collaboration and presentations.
Easily adjust chart settings and parameters.
ChartBrick

Join the AI revolution and explore the world of artificial intelligence. Stay connected with us.
Copyright © 2025 AI-ARCHIVE
Today Listed Tools 226
Discover 7422 Tools