Discover 7422 Tools

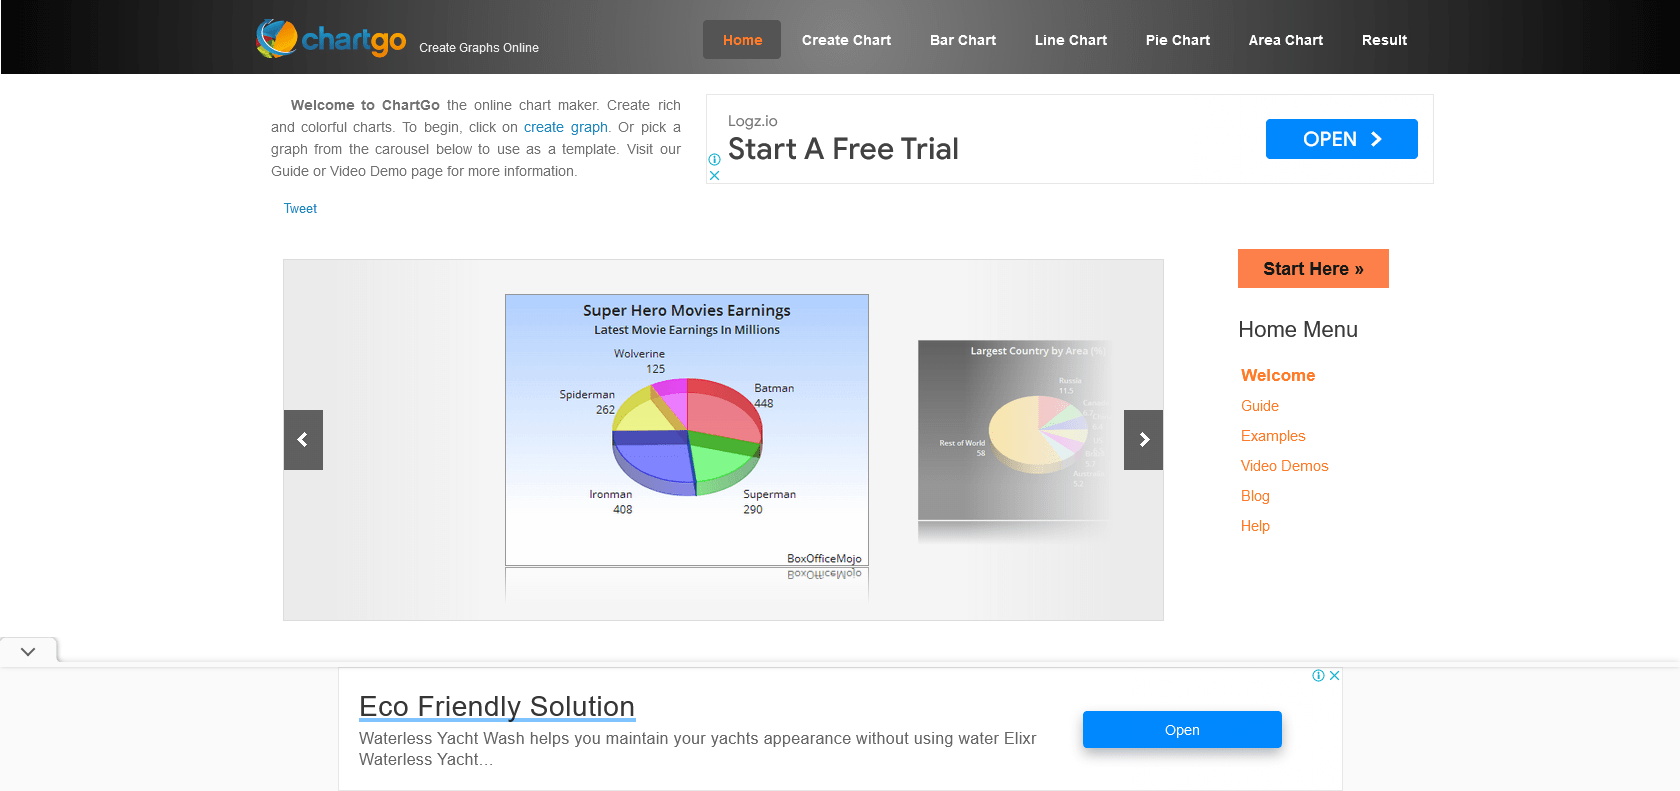
Screenshot of Chart Go Website

Quickly create stunning visuals with customizable tools.

Chart Go: Create Professional-Looking Visuals with Drag-and-Drop Interface

Chart Go: Create professional visuals quickly with a drag-and-drop interface. Customize charts to exact specifications. Easily share creations in multiple formats.

Chart Go

Share on:
Screenshot of Chart Go Website

Introducing Chart Go: Effortlessly Create, Customize, and Share Professional-looking Visuals

Chart Go is an online charting service that allows users to create and customize charts, graphs, and diagrams with just a few clicks. Whether you're a business professional, a teacher, or a student, Chart Go makes it simple to transform any type of data into visually appealing visuals. The platform offers a range of powerful tools that give users the ability to customize their charts to their exact specifications. You can add text, images, and even animations to make your creations truly stand out.

One of the standout features of Chart Go is its intuitive drag-and-drop interface. This makes it incredibly easy to build stunning visuals without having to spend hours learning complicated software. With just a few simple actions, you can quickly create charts that are both professional and eye-catching.

Sharing your creations with others is a breeze with Chart Go. The platform allows you to easily export your charts in a variety of formats, including PDF, PNG, and SVG. Whether you need to print out your charts for a presentation or share them online, Chart Go has you covered.

In addition to its user-friendly features, Chart Go also prioritizes security. You can trust that your data is safe and secure when using this platform, giving you peace of mind while you work.

For Who?

Chart Go is the perfect tool for individuals and businesses looking to accelerate productivity and improve efficiency in their job or business. Whether you are a teacher, student, or part of a company, Chart Go can help you create professional-looking visuals quickly and easily.

For businesses, Chart Go allows you to create visually appealing charts and graphs to present data during meetings or presentations. The powerful customization tools enable you to customize the charts to your exact specifications, ensuring that your visuals stand out and capture the attention of your audience. You can add text, images, and animations to enhance your charts further.

Teachers can use Chart Go to create engaging visuals for their students. Whether you want to create graphs for math lessons or illustrate scientific data, Chart Go provides an intuitive drag-and-drop interface that allows you to quickly build stunning visuals with minimal effort. This will help you communicate complex information in a clear and visual way, making it easier for students to understand and retain the information.

Similarly, students can use Chart Go to create visuals for their assignments or presentations. The simplicity of the drag-and-drop interface makes it easy for students to create charts and graphs from any type of data, whether it's for a science experiment or a history project. With Chart Go, students can create professional-looking visuals that will impress their teachers and classmates.

Furthermore, Chart Go makes it easy to share your creations with others. You can save your visuals in multiple formats such as PDF, PNG, and SVG, making it convenient to share them with colleagues, classmates, or clients. This feature ensures seamless collaboration and effortless sharing of information.

Lastly, Chart Go prioritizes the security of your data. You can trust that your information is safe and secure while using the platform to create and store your visuals.

No matter your profession or industry, Chart Go is an excellent tool to accelerate productivity and enhance the quality of your work. Its ease of use, customization options, and sharing capabilities make it an indispensable asset for anyone who needs to create professional-looking visuals quickly and efficiently.

Main Features

Provides a highly secure environment for data.

Benefits of using Chart Go

Chart Go is a versatile online charting service that offers numerous benefits in real-world examples. With its drag-and-drop interface, users can create professional-looking visuals quickly and effortlessly. Whether you're a busy business professional, a dedicated teacher, or a curious student, Chart Go can streamline the process of visualizing data, making it easy for anyone to communicate complex information effectively.

One of the key advantages of Chart Go is its ability to customize charts to exact specifications. With a range of powerful tools at your disposal, you have complete control over the appearance and style of your charts. This level of customization enables you to create visuals that perfectly align with your brand identity or specific project requirements, making your presentations and reports more impactful and professional.

Furthermore, Chart Go allows you to easily share your creations in multiple formats. Whether you prefer the reliable PDF format or need high-resolution images in PNG or SVG format for further editing or embedding in other applications, Chart Go has got you covered. This flexibility in sharing ensures that your charts and diagrams can be seamlessly integrated into various documents and platforms, enhancing your ability to communicate your ideas and data effectively.

Additionally, Chart Go prioritizes data security. As an online service, it ensures that your data remains safe and secure at all times. This feature is particularly important for businesses dealing with sensitive data or individuals who value their privacy. You can trust that your information is in good hands and focus on creating impressive visuals without any concerns.

Full Review

Chart Go is an online charting service that allows users to create professional-looking visuals quickly and easily. The tool features a user-friendly drag-and-drop interface that makes it a breeze to create stunning charts, graphs, and diagrams with just a few clicks. Whether you need to visualize sales data, analyze trends, or present information to clients or colleagues, Chart Go has got you covered.

One of the standout features of Chart Go is its powerful customization options. With a range of tools at your disposal, you can easily personalize your charts to your exact specifications. You can choose from a variety of chart types, add text, images, and even animations to make your visuals more engaging and interactive. This level of customization allows you to create unique and eye-catching visuals that effectively convey your message.

Another great aspect of Chart Go is its versatility when it comes to sharing your creations. You can easily export your charts in multiple formats, including PDF, PNG, and SVG. This makes it convenient to share your visuals with others, whether it's through email, presentations, or publishing on a website or blog.

Furthermore, Chart Go places a strong emphasis on security, ensuring that your data is safe and secure. This is particularly important when dealing with sensitive information or proprietary data. With Chart Go, you can have peace of mind knowing that your data is protected.

In conclusion, Chart Go is an excellent tool for creating professional-looking visuals quickly and easily. Its drag-and-drop interface, powerful customization options, and convenient sharing features make it a top choice for businesses, teachers, and students alike. Whether you need to create charts for data analysis, presentations, or educational purposes, Chart Go is a reliable and efficient tool that will help you achieve exceptional results.

Chart Go

Pros:

- Create professional visuals quickly with a drag-and-drop interface.
- Customize charts to exact specifications with powerful tools.
- Easily share creations in multiple formats like PDF, PNG, and SVG.
- Chart Go is highly secure, ensuring data safety.

Cons:

- Limited options for data analysis and advanced chart customization
- Some users may find the drag-and-drop interface to be less flexible and time-consuming compared to other charting services.

Popular AI

Similar Archives

{{ reviewsTotal }}{{ options.labels.singularReviewCountLabel }}
{{ reviewsTotal }}{{ options.labels.pluralReviewCountLabel }}
{{ options.labels.newReviewButton }}
{{ userData.canReview.message }}

Explore Similar AI Tools: