Discover 7422 Tools

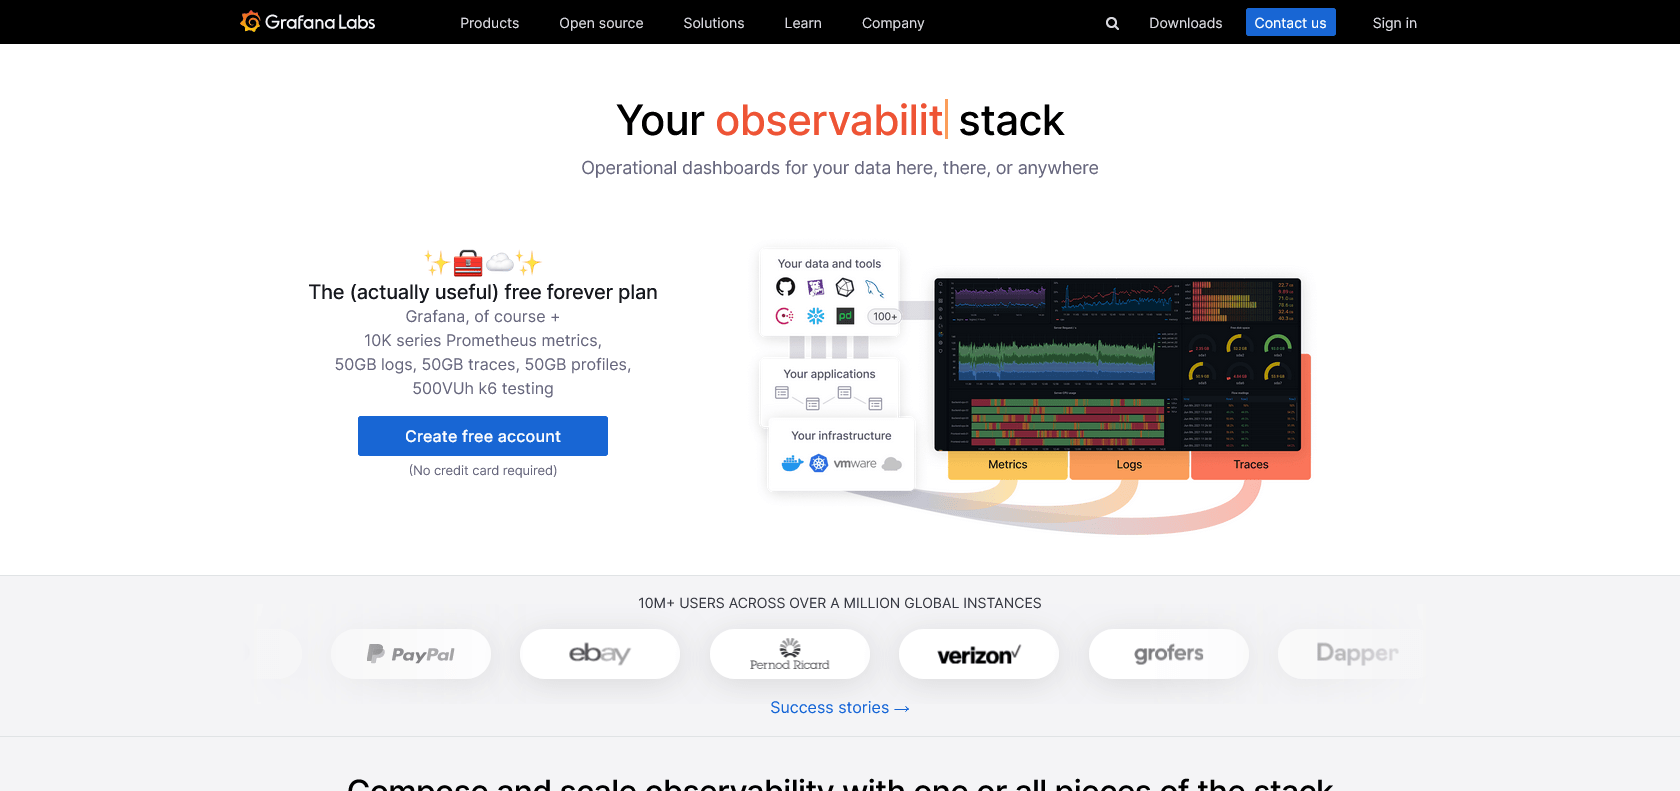
Screenshot of Grafana Website

Gain deep insights with Grafana's analytics.

Visualize Data and Track Performance Metrics with Grafana: Review & Features

Discover the benefits of Grafana: monitor applications, systems, and infrastructure with visualizations, advanced alerting, and customizable dashboards.

Grafana

Share on:
Screenshot of Grafana Website

Grafana: Your Ultimate Analytics and Monitoring Tool

Grafana is an open source platform that’s designed to make analytics and monitoring a breeze. With its powerful features and user-friendly interface, Grafana allows you to visualize data and monitor performance metrics with ease. Whether you’re a developer, a DevOps engineer, or an IT professional, Grafana has something to offer you.

One of the standout features of Grafana is its ability to create visually stunning dashboards and charts. With just a few clicks, you can create a dashboard that displays all the relevant information you need to track. From application performance to system health, Grafana helps you keep a close eye on everything.

But Grafana doesn’t stop at just displaying data. It also offers advanced alerting and notification features. With these features, you can set up alerts for any metric you’re tracking. Whether it’s CPU usage, network latency, or database performance, Grafana will let you know if something goes wrong.

Another major strength of Grafana is its ability to integrate with various data sources. Whether you’re pulling data from a SQL database, a cloud service, or even a custom-built API, Grafana has got you covered. You can easily connect your data and create custom visualizations that suit your needs.

For Who?

Grafana is a powerful tool that can greatly accelerate productivity for a variety of professionals. It is especially useful for developers, DevOps engineers, and IT professionals who need to monitor their applications and infrastructure.

With Grafana, users can create visually appealing dashboards and charts to track performance metrics in a quick and simple manner. This allows them to easily monitor the health and performance of their applications, systems, and infrastructure.

One of Grafana's standout features is its advanced alerting and notification system. Users can set up alerts to notify them when specific metrics or thresholds are met. This ensures that potential issues or anomalies are quickly identified and addressed, helping to maintain the smooth operation of their systems.

Grafana also offers seamless integration with various data sources. Users can easily connect their data to Grafana, allowing them to create custom visualizations that provide deep insights into their data. This flexibility enables professionals to better analyze and understand their data, helping them to make informed decisions.

Furthermore, Grafana provides a comprehensive set of APIs and SDKs, making it easy for users to integrate their data into the platform. This allows for even more customization and the creation of unique visualizations tailored to specific needs.

Main Features

Gain valuable insights and make informed decisions with Grafana's powerful analytics capabilities.

Benefits of using Grafana

Grafana is a versatile tool that offers a wide range of benefits in real-world scenarios. With its ability to create visualizations and dashboards, users can quickly and easily monitor their applications, systems, and infrastructure. This means that developers, DevOps engineers, and IT professionals can have a clear and intuitive view of their data, enabling them to make informed decisions and take necessary actions promptly.

One of the key features of Grafana is its advanced alerting and notification system. Users can set up alerts based on specific performance metrics, ensuring that they are promptly notified of any issues or potential problems that may arise. This allows for proactive troubleshooting and fast resolution of issues, minimizing downtime and ensuring the smooth operation of applications and systems.

Grafana also excels in data source integration, offering seamless connections to a wide range of data sources. This means that users can easily import data from various systems and databases into Grafana, consolidating all their data in one place. With this consolidated view, users can gain a holistic understanding of their data and identify correlations and patterns that would have otherwise been missed. Furthermore, Grafana allows users to create custom visualizations, providing them with the flexibility to tailor their dashboards to suit their specific needs and preferences.

In addition to its powerful features, Grafana also offers a comprehensive set of APIs and SDKs. This allows users to integrate their own data sources and build custom visualizations, further expanding the capabilities of Grafana. By enabling this level of customization and integration, Grafana becomes a truly versatile tool that can be tailored to meet the unique requirements of different industries and use cases.

Full Review

We have thoroughly reviewed Grafana, an open source platform for analytics and monitoring, and we are impressed with its powerful features and flexibility.

One of the standout features of Grafana is its ability to create visualizations and dashboards for monitoring applications, systems, and infrastructure. The intuitive interface allows users to easily drag and drop components to create visually appealing and informative dashboards. Whether you need to monitor the performance of your servers, track application metrics, or analyze trends in your data, Grafana provides an extensive range of visualizations and charting options to suit your needs.

Another great feature of Grafana is its advanced alerting and notification system. Users can set up alerts based on predefined thresholds or custom conditions, ensuring that they are promptly notified of any anomalies or potential issues. This feature is invaluable for staying on top of performance metrics and ensuring the smooth operation of your applications and infrastructure.

Grafana also excels in its data source integration capabilities. It supports a wide range of data sources, including popular databases, cloud services, and monitoring systems. This allows users to bring in data from multiple sources and create comprehensive visualizations and dashboards that provide holistic insights. Additionally, Grafana provides APIs and SDKs, making it easy to integrate your own data sources and create customized visualizations.

One aspect that sets Grafana apart from other monitoring tools is its customization options. Users have the ability to personalize their dashboards with custom themes, templates, and annotations. This level of flexibility allows users to tailor the interface to their specific needs and preferences.

In conclusion, Grafana is an excellent tool for developers, DevOps engineers, and IT professionals who require robust monitoring and analytics capabilities. Its ability to create customizable dashboards, advanced alerting system, and seamless integration with various data sources make it a top choice for monitoring applications and infrastructure. With Grafana, users can gain deep insights into their data and make informed decisions.

Grafana

Pros:

- Real-time monitoring for quick issue identification
- Comprehensive set of APIs and SDKs
- Flexible customization options for visualizations
- Provides deep insights for informed decision-making

Cons:

- Limited customization options for non-technical users.
- Steep learning curve for beginners.

Popular AI

Similar Archives

{{ reviewsTotal }}{{ options.labels.singularReviewCountLabel }}
{{ reviewsTotal }}{{ options.labels.pluralReviewCountLabel }}
{{ options.labels.newReviewButton }}
{{ userData.canReview.message }}

Explore Similar AI Tools: