Discover 7422 Tools

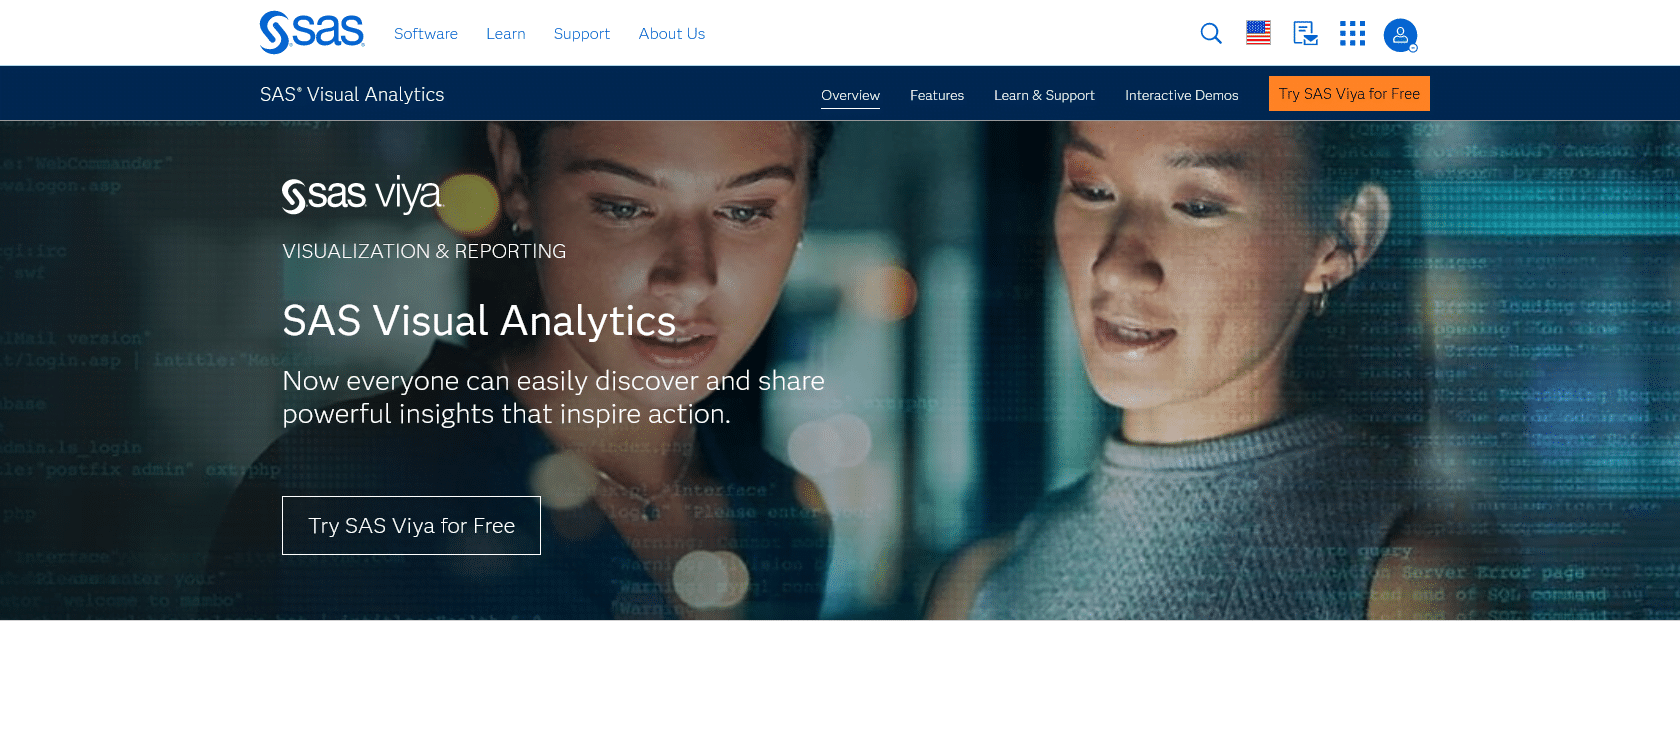
Screenshot of SAS Visual Analytics Website

Easily analyze data, share insights visually.

10 Key Features of SAS Visual Analytics for Data Exploration

Uncover patterns, trends, and relationships with SAS Visual Analytics. Create visually appealing dashboards. Customize visualizations to suit individual needs.

SAS Visual Analytics

Share on:
Screenshot of SAS Visual Analytics Website

SAS Visual Analytics: Unleash the Power of Data Visualization

SAS Visual Analytics is a powerful tool that allows users to explore large datasets and extract valuable insights from them. Its user-friendly interface and intuitive features make it easy for users to uncover patterns, trends, and relationships within their data. With the ability to create visually appealing dashboards, users can effectively share their findings with colleagues and stakeholders. The software also offers customization options, allowing users to tailor their visualizations to suit their specific needs. Overall, SAS Visual Analytics is a valuable asset for businesses seeking to harness the power of their data and make informed decisions.

For Who?

SAS Visual Analytics is a tool that is ideal for professionals and businesses looking to accelerate productivity in their job or business. This software is especially useful for data analysts and business intelligence professionals who need to explore and analyze large datasets quickly and efficiently. With the intuitive interface and powerful features of SAS Visual Analytics, users can uncover patterns, trends, and relationships within their data in a matter of seconds. This not only saves time, but also allows users to make informed decisions and develop meaningful conclusions from their data.

Furthermore, SAS Visual Analytics allows users to create visually appealing dashboards that make it easy to share insights with colleagues. These dashboards are not only informative, but also engaging, making it easier for others to understand and interpret the data. The drag-and-drop functionality of this tool also enables users to customize their visualizations to suit their individual needs, ensuring that the data is presented in the most effective way possible.

Main Features

Explore large datasets quickly and easily.

Analyze insights from your data.

Develop meaningful conclusions from patterns and trends.

Collaborate effectively with colleagues for data analysis.

Benefits of using SAS Visual Analytics

SAS Visual Analytics is a powerful tool that offers numerous benefits in real-world scenarios. By using this tool, users can quickly uncover patterns, trends, and relationships within their data. This is particularly useful in industries such as finance, where analyzing market trends and predicting future outcomes are crucial.

Another benefit of SAS Visual Analytics is its ability to create visually appealing dashboards. These dashboards allow users to present their insights in an engaging and informative way, making it easier for colleagues and stakeholders to understand complex data. This feature is especially valuable in industries such as marketing, where presenting data in a visually appealing manner is essential for effective communication.

Furthermore, SAS Visual Analytics offers the flexibility to customize visualizations to suit individual needs. This allows users to present data in a way that is most meaningful and relevant to their specific business requirements. Whether it is creating charts, graphs, or maps, users have the ability to tailor their visualizations to effectively communicate their insights.

Full Review

In our review of SAS Visual Analytics, we found that the software excels at helping users uncover patterns, trends, and relationships within their data quickly and easily. Its intuitive interface allows for seamless exploration of large datasets, making it a powerful tool for data analysis.

One of the standout features of SAS Visual Analytics is its ability to create visually appealing dashboards. These dashboards are not only aesthetically pleasing, but they also effectively convey insights and tell the story of the data. Users can customize their visualizations to suit their individual needs, allowing for a more personalized and impactful presentation of their findings.

The software's drag-and-drop functionality makes it easy for users to create and modify visualizations without the need for extensive coding knowledge. This makes SAS Visual Analytics accessible to a wide range of users, including those with no background in data analysis.

Another notable feature of SAS Visual Analytics is its cloud-based nature. This allows for easy collaboration and sharing of insights with colleagues. With the ability to quickly and securely share dashboards and reports, teams can collaborate more effectively and make data-driven decisions with ease.

Overall, SAS Visual Analytics is a powerful and user-friendly tool for exploring and visualizing data. Its ability to quickly uncover insights, create visually appealing dashboards, and allow for customization makes it an essential tool for any business looking to gain valuable insights from their data.

SAS Visual Analytics

Pros:

- Collaborate effectively with colleagues on data analysis.

Cons:

- Limited customization options for visualizations.
- May require technical expertise to fully utilize all features.

Popular AI

Similar Archives

{{ reviewsTotal }}{{ options.labels.singularReviewCountLabel }}
{{ reviewsTotal }}{{ options.labels.pluralReviewCountLabel }}
{{ options.labels.newReviewButton }}
{{ userData.canReview.message }}

Explore Similar AI Tools: