Discover 7422 Tools

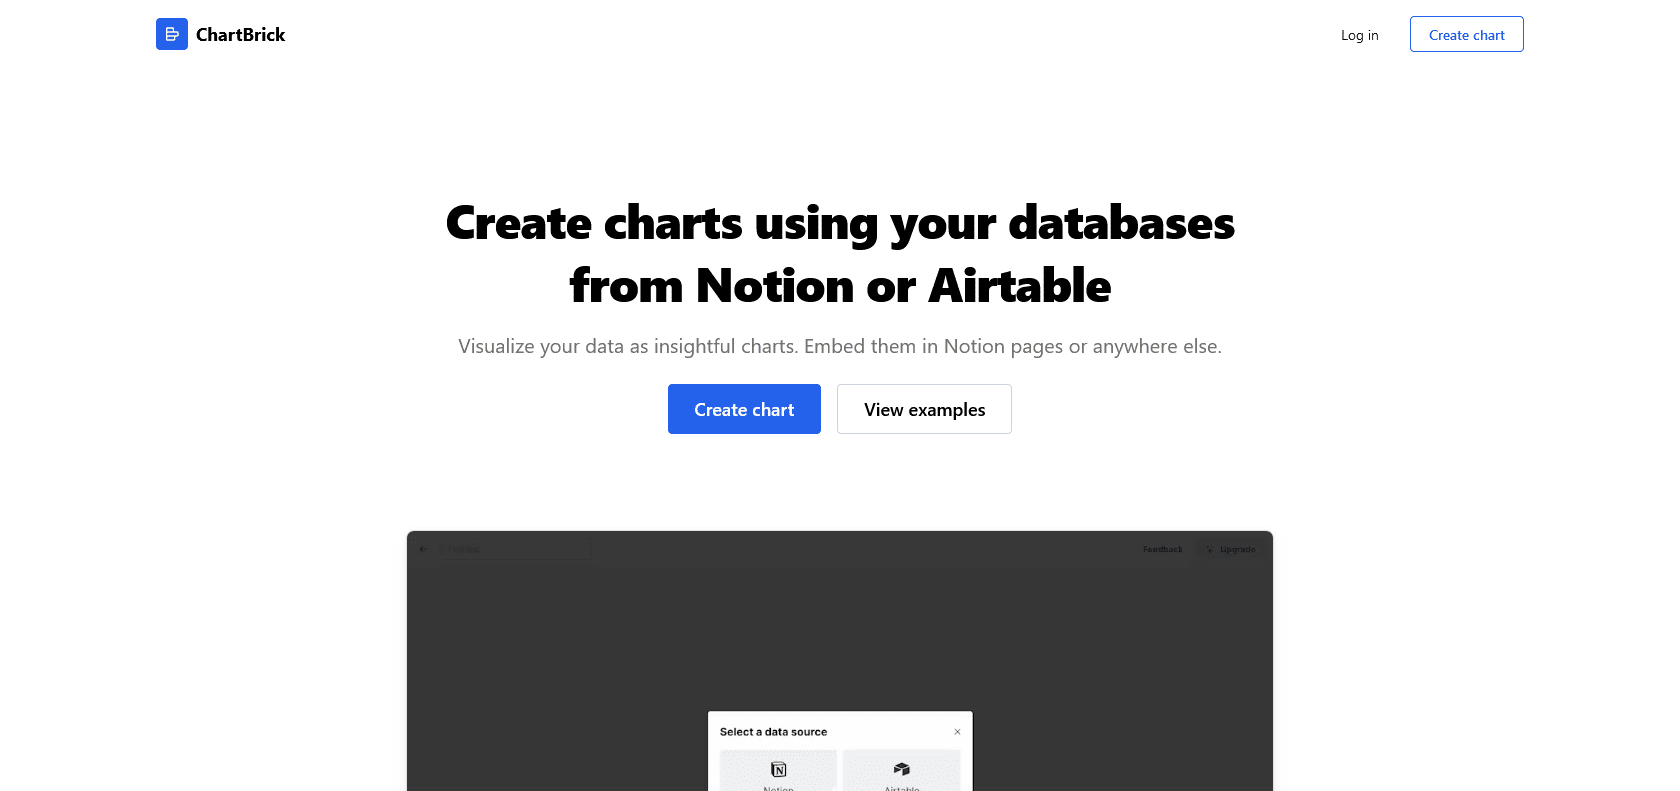
Screenshot of ChartBrick Website

Elevate your data with ChartBrick.

ChartBrick: Create Interactive Charts and Data Visualizations Easily

ChartBrick Review and Features: Easily create interactive charts, customize their appearance, access templates, and make data visually engaging with ChartBrick.

ChartBrick

Share on:
Screenshot of ChartBrick Website

ChartBrick: Effortlessly Create Stunning Interactive Charts and Visualizations

ChartBrick is an exceptional platform that brings the power of data visualization and analysis to users of all backgrounds. Whether you are a seasoned data analyst, a student, or simply someone who wants to make sense of their data, ChartBrick is designed to make the process quick, easy and visually appealing.

One of the standout features of ChartBrick is its intuitive drag-and-drop chart builder. With just a few clicks, you can transform your raw data into stunning interactive charts and visualizations. The user-friendly interface allows you to easily adjust settings and parameters, giving you complete control over the look and feel of your charts.

For those who want to take their visualizations to the next level, ChartBrick offers a library of pre-made templates and color schemes. These templates provide a starting point for your visualizations and allow you to effortlessly create professional-looking charts that will impress your audience.

Not only does ChartBrick make it easy to create visually engaging charts, but it also makes sharing your visualizations a breeze. With just a few clicks, you can share your charts with colleagues, clients, or classmates. This makes ChartBrick a valuable tool for collaboration and presentations.

For Who?

ChartBrick is a valuable tool for a wide range of individuals in various professions and industries. Business professionals can utilize ChartBrick to accelerate their productivity by easily and efficiently analyzing large amounts of data. Whether it's sales figures, market trends, or customer feedback, ChartBrick allows professionals to create stunning, interactive charts and visualizations that bring data to life.

For students, ChartBrick provides a user-friendly platform to understand and present research data. With its intuitive drag-and-drop chart builder, students can quickly transform their raw data into visually appealing and engaging visualizations. This not only improves their ability to comprehend the data but also helps them communicate their findings effectively.

Data enthusiasts and professional analysts will appreciate ChartBrick's extensive library of pre-made templates and color schemes. These resources allow users to enhance their visualizations, making their data more visually appealing and easily understandable. By customizing the look and feel of their charts, analysts can effectively convey complex information to their audience.

Main Features

Easily adjust chart settings and parameters.

Benefits of using ChartBrick

ChartBrick is a tool that offers several benefits for real world examples. Firstly, it allows you to quickly create interactive charts and data visualizations. This is advantageous for professionals, students, and data enthusiasts who need to present their data in a clear and visually appealing manner. With ChartBrick, you can easily transform raw data into dynamic charts that are engaging and interactive.

Secondly, ChartBrick provides the ability to customize the look and feel of your charts. This means that you can tailor your visualizations to match your specific needs and preferences. Whether it's adjusting colors, fonts, or chart styles, ChartBrick's intuitive drag-and-drop chart builder makes it easy to create charts that reflect your personal style or align with your brand guidelines.

In addition, ChartBrick offers a library of pre-made templates and color schemes. This feature proves to be a time-saving resource, allowing you to choose from a variety of professionally designed templates that suit your data visualization needs. These templates can help create visually stunning charts and infographics with just a few clicks.

Lastly, ChartBrick allows you to easily adjust chart settings and parameters. This flexibility enables you to fine-tune your visualizations according to your specific requirements. Whether it's changing the axis labels, adjusting data ranges, or selecting different chart types, ChartBrick provides the tools necessary to customize your charts to best represent your data accurately.

Full Review

At ChartBrick, we strive to provide a powerful and user-friendly platform for data visualization and analysis. Our tool allows users to easily and quickly create stunning, interactive charts and data visualizations from their raw data. Whether you are a professional data analyst, a student, or a non-technical user, ChartBrick is designed to help you understand your data and uncover valuable insights.

One of the standout features of ChartBrick is our intuitive drag-and-drop chart builder. This allows users to effortlessly create charts without any coding or complex technical skills. You can simply drag the data elements you want to visualize and drop them onto the chart canvas. It's that easy! This feature makes ChartBrick accessible to users of all levels of technical expertise.

In addition to the drag-and-drop chart builder, ChartBrick also offers a range of customization options. You have the ability to modify the look and feel of your charts, ensuring they align with your branding or personal preferences. You can choose from a library of pre-made templates and color schemes, which further enhance the visual appeal of your data. With ChartBrick, you can create charts that truly stand out and captivate your audience.

Another notable feature of ChartBrick is the ability to adjust chart settings and parameters with ease. This allows you to fine-tune your visualizations and make them more insightful and impactful. Whether you need to change the chart type, adjust axis labels, or apply advanced statistical analysis, ChartBrick gives you the flexibility to do so effortlessly.

Lastly, ChartBrick enables easy sharing and collaboration. You can easily share your visualizations with others, whether it's through direct links, embedding into websites, or downloading the charts as image files. This makes it convenient for teams to collaborate and for individuals to share their insights with stakeholders.

Overall, ChartBrick is the perfect tool for anyone looking to make their data more accessible and visually engaging. Whether you are a business professional, a student, or a data enthusiast, ChartBrick empowers you to analyze your data quickly and uncover meaningful insights. With its powerful features, user-friendly interface, and wide range of customization options, ChartBrick is a must-have for anyone working with data.

ChartBrick

Pros:

- Adjust chart settings and parameters easily.
- Share visualisations with others.

Cons:

- Limited customization options for advanced users.
- May require a learning curve for non-technical users.

Popular AI

Similar Archives

{{ reviewsTotal }}{{ options.labels.singularReviewCountLabel }}
{{ reviewsTotal }}{{ options.labels.pluralReviewCountLabel }}
{{ options.labels.newReviewButton }}
{{ userData.canReview.message }}

Explore Similar AI Tools: