Discover 7422 Tools

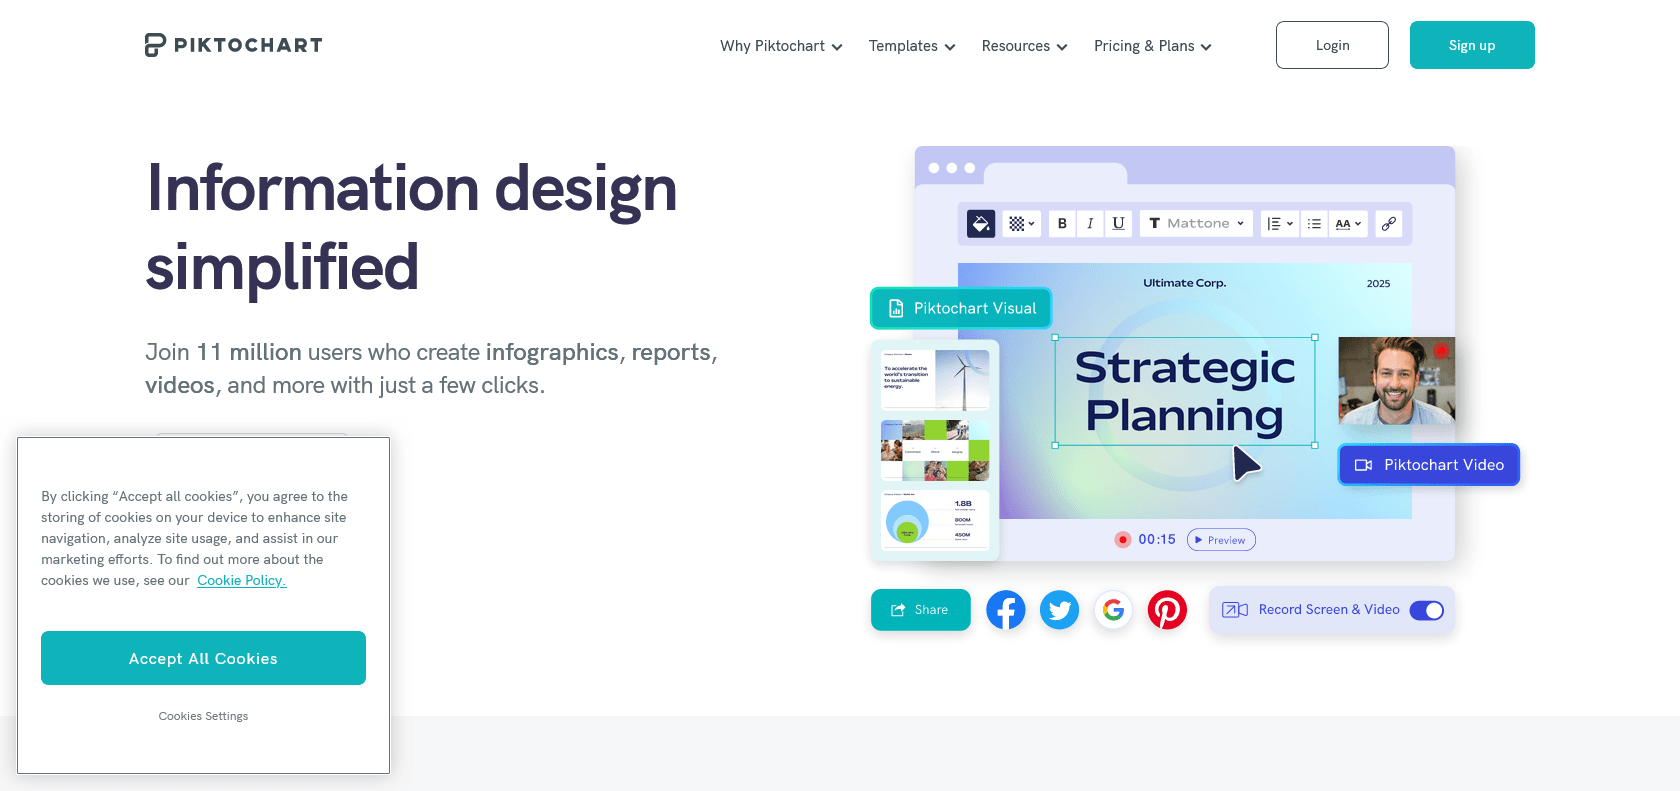
Screenshot of Piktochart Website

Express your ideas with stunning visuals.

Piktochart Review: Create Stunning Infographics, Engage Clients, and Analyze Reports

Discover the power of Piktochart for creating stunning infographics, engaging presentations, and professional reports with analytics. Get noticed today!

Piktochart

Share on:
Screenshot of Piktochart Website

Unleash Your Creativity with Piktochart: Create Stunning Visuals for Social Media, Presentations, and Reports

Piktochart is a game-changing tool that allows you to create stunning and visually appealing infographics, reports, presentations, and data visualizations. Whether you're a beginner or a seasoned designer, this user-friendly platform empowers you to express your ideas with ease and professionalism.

One of the standout features of Piktochart is its extensive library of high-quality templates, icons, and illustrations. These resources enable you to create visuals that not only look visually appealing but also grab the attention of your audience. From eye-catching charts and graphs to attractive diagrams, Piktochart has it all.

The intuitive drag-and-drop editor is another highlight of Piktochart. It makes customization a breeze, allowing you to effortlessly personalize your designs to suit your specific needs. You can easily add text, images, and other elements, ensuring that your visuals truly represent your ideas.

Furthermore, Piktochart offers a powerful analytics feature that lets you track the performance of your visuals. This feature provides valuable insights into how your creations are being engaged with, allowing you to make data-driven decisions and maximize their impact.

For Who?

Piktochart is an invaluable tool for a wide range of professionals who want to accelerate their productivity and enhance the impact of their work. Whether you are a social media marketer, a sales professional, or a data analyst, Piktochart can help you create visually compelling content that will capture attention and drive results.

For social media marketers, Piktochart offers a seamless way to create stunning infographics that are perfectly optimized for sharing on platforms like Facebook, Instagram, and Twitter. With its vast library of templates, icons, and illustrations, you can effortlessly design visuals that will grab your audience's attention, tell a story, and effectively communicate your message.

If you are a sales professional, Piktochart can be a game-changer for designing presentations that truly engage your clients. With its easy-to-use interface, you can create visually appealing slides that showcase your products or services in a professional and compelling manner. By utilizing Piktochart's features, such as the drag-and-drop editor, you can quickly customize your presentations to match your brand and captivate your audience.

Data analysts and researchers will also appreciate Piktochart's ability to generate professional-looking reports with analytics. With its robust analytics feature, you can track the performance of your visuals and gain valuable insights into the effectiveness of your data presentation. This allows you to make data-driven decisions and effectively communicate your findings to stakeholders or clients.

No matter your profession or industry, Piktochart provides a user-friendly and efficient solution for creating visually stunning visuals that will help you stand out in a crowded marketplace. With its extensive range of features and customization options, Piktochart empowers you to express your ideas, engage your audience, and accelerate your productivity.

Main Features

Create stunning infographics for social media

Design presentations to engage clients

Generate professional-looking reports with analytics

Benefits of using Piktochart

Piktochart offers a range of benefits when it comes to creating visuals for real-world examples. Here are some key advantages:

1. Create stunning infographics for social media: With Piktochart's user-friendly interface and extensive template library, you can easily design captivating and eye-catching infographics for your social media channels. Whether you want to share information, promote a product, or convey a message, Piktochart allows you to present data in a visually appealing way that will engage your audience and make your content more shareable.

2. Design presentations to engage clients: Piktochart enables you to create professional-looking presentations that will impress clients and stakeholders. With its easy-to-use drag-and-drop editor and customizable features, you can create visually stunning slides that effectively communicate your ideas and leave a lasting impression. From sales pitches to project updates, Piktochart helps you deliver your message confidently and professionally.

3. Generate professional-looking reports with analytics: Piktochart allows you to create comprehensive and visually appealing reports that effectively communicate data and insights. Whether you need to present business metrics, research findings, or project reports, Piktochart's templates and design options enable you to create visually engaging reports that are easy to understand. Additionally, with the analytics feature, you can track the performance of your visuals, gather valuable insights, and understand how your audience interacts with your content.

Full Review

We recently had the opportunity to try out Piktochart, a fantastic tool for creating visually appealing infographics, presentations, and reports. We were impressed with its user-friendly interface and the extensive range of features it offers. Whether you are a social media enthusiast looking to create stunning infographics, a business professional wanting to engage clients with captivating presentations, or a data analyst needing to generate professional-looking reports with analytics, Piktochart has got you covered.

First and foremost, Piktochart's library of high-quality templates is a real game-changer. It provides a wide variety of options, ensuring that no matter what your topic or design preferences may be, you will find a template that suits your needs. Each template is customizable, allowing you to add your own content and personalize your design to align with your brand or message.

The drag-and-drop editor in Piktochart is intuitive and makes the design process a breeze. Even if you have little to no design experience, you can easily create visually appealing visuals by simply dragging and dropping elements onto your canvas. The editor offers a range of design tools, such as font styles, color palettes, and shapes, enabling you to add that extra touch of creativity to your visuals.

One of the standout features of Piktochart is its analytics capability. With the ability to track the performance of your visuals, you can gain valuable insights into how your audience is engaging with your content. This feature allows you to measure the effectiveness of your visuals and make data-driven decisions to optimize your future designs.

We were thoroughly impressed with the versatility of Piktochart. Not only did it cater to our needs for creating eye-catching infographics, but it also provided us with the tools to design engaging presentations and professional-looking reports. This versatility makes Piktochart a valuable tool for individuals and businesses across various industries.

In conclusion, Piktochart is a powerful and user-friendly tool for creating beautiful visuals. Its extensive library of templates, intuitive drag-and-drop editor, and analytics capabilities make it a go-to choice for anyone looking to create stunning infographics, presentations, or reports. With Piktochart, you can easily express your ideas, engage your audience, and make your message stand out.

Piktochart

Pros:

- Stunning infographics for social media
- Engaging presentations for clients
- Professional-looking reports with analytics

Cons:

- Limited customization options for advanced designers.
- Some users have experienced occasional glitches.

Popular AI

Similar Archives

{{ reviewsTotal }}{{ options.labels.singularReviewCountLabel }}
{{ reviewsTotal }}{{ options.labels.pluralReviewCountLabel }}
{{ options.labels.newReviewButton }}
{{ userData.canReview.message }}

Explore Similar AI Tools: